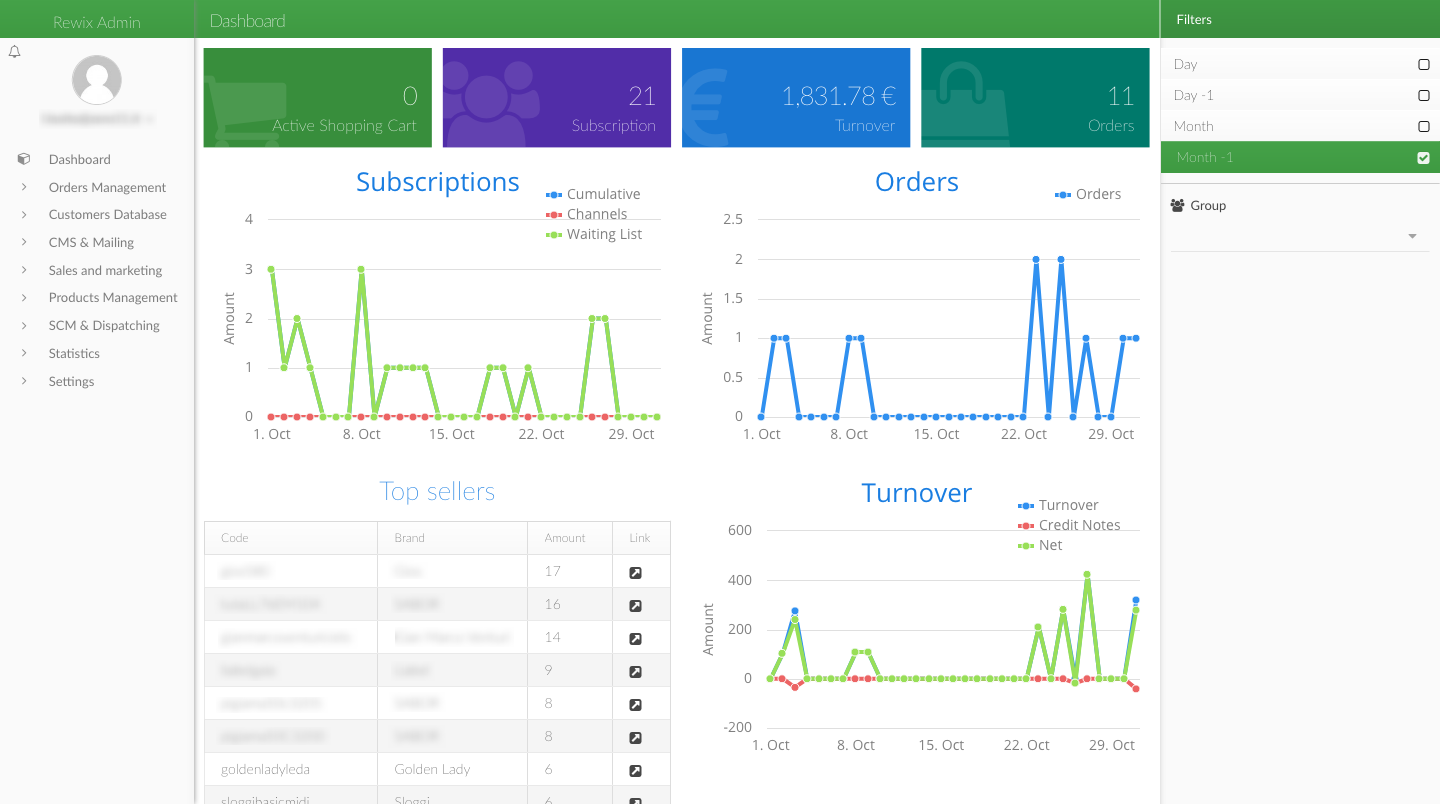
DASHBOARD
In the dashboard you can find all the statistics about products sellingand website subscriptions.
 Filter on Statistics
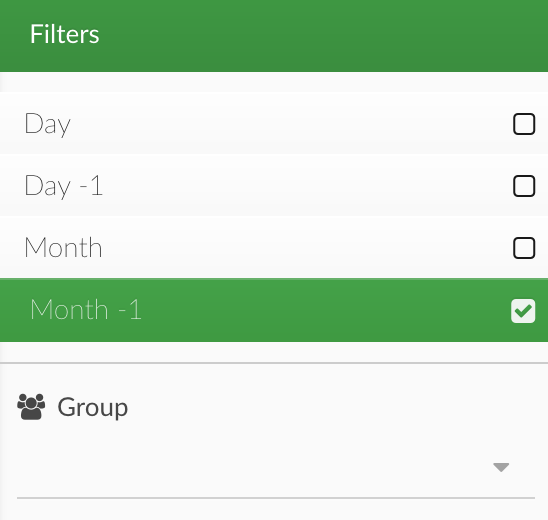
Through this toolbar it's possible to set the monitor time interval.
In the first field you can specify the starting date and in the second the final date. In the next field you can chose to show the monthly or daily trend using the corresponding radio button.
You can use the button
to apply the filter on the graphs below.
 Subscriptions
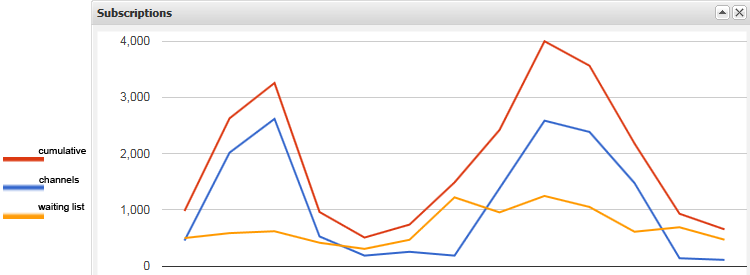
The graph shows the website's subscription trend for the period specified in section .
-
Channels: it shows the subscription's trend of users coming from channels monitored by the platform. You'll learn more about channels later in this guide.
-
Waiting List: it shows the subscription trend of users coming from channels not monitored by the platform.
-
Cumulative: it displays both Channel and Waiting list subscriptions.
 Bestsellers
Most sold products are showed in the Bestseller graph. Moving the mouse over the graph it's possible to have a look at the specific number of sold products.
 Turnover
Turnover graph shows platform's revenue.
 Worstsellers
Worstsellers graph shows less sold products of the platform. Moving the mouse over the graph it's possible to have a look at the specific number of sold products.
 Top buyers: orders
This graph shows the list of customers who have made more orders.
 Top buyers: turnover
This graph shows the list of customers with higher turnover.